All across the country, it now takes a little longer for sellers to offload their properties than it did last year, as buyers are kept to the sidelines by sky-high prices and elevated mortgage rates.
For-sale homes in the United States were spending a median of 53 days on the market last month before going under contract, five more than a year ago, according to the latest figures by Realtor.com.
But while listings are generally spending longer on the market, there are a few markets that remain very competitive and where the median days on the market of a home for sale actually went down last month compared to a year earlier.
Where Homes Are Selling Fastest
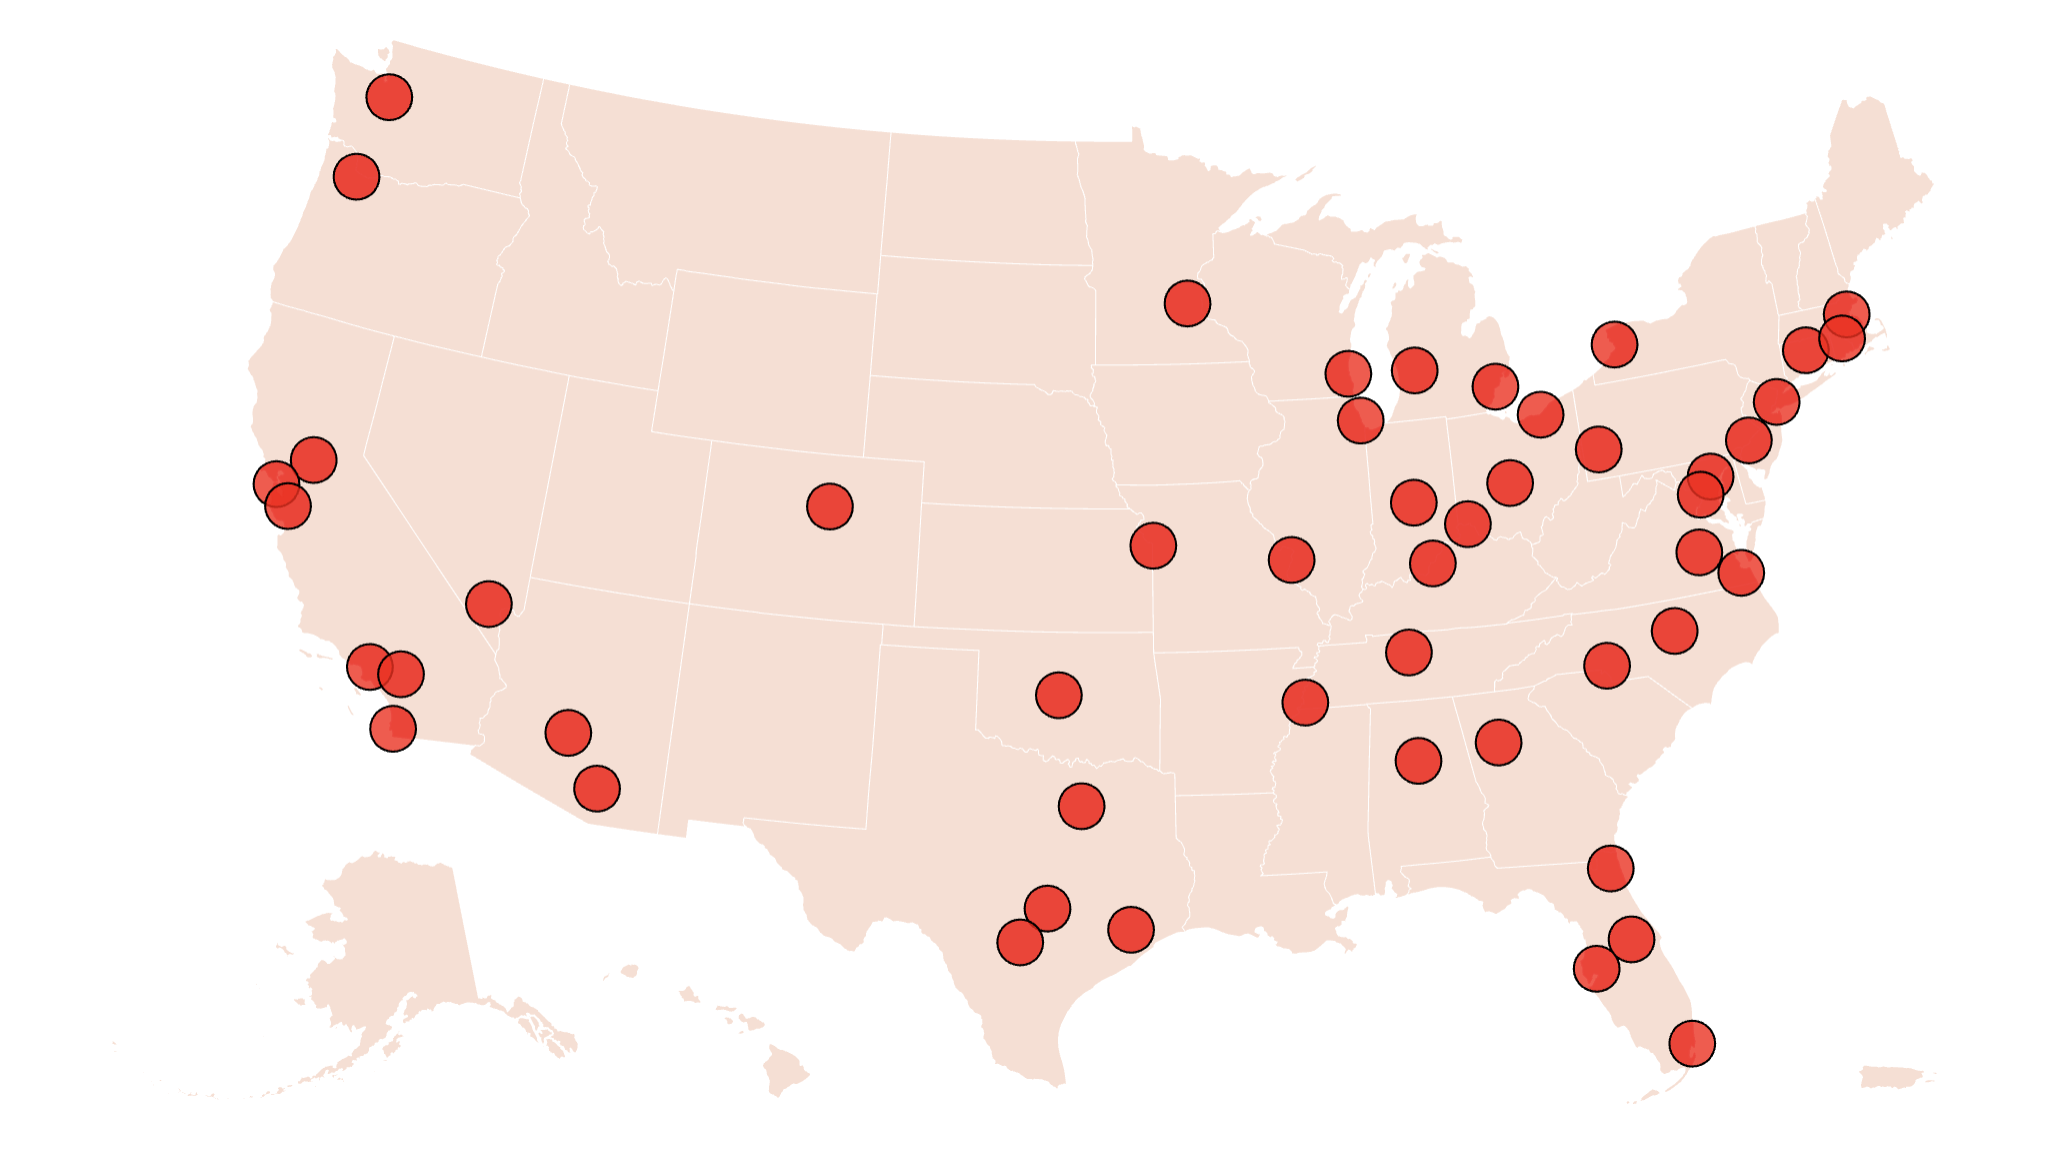
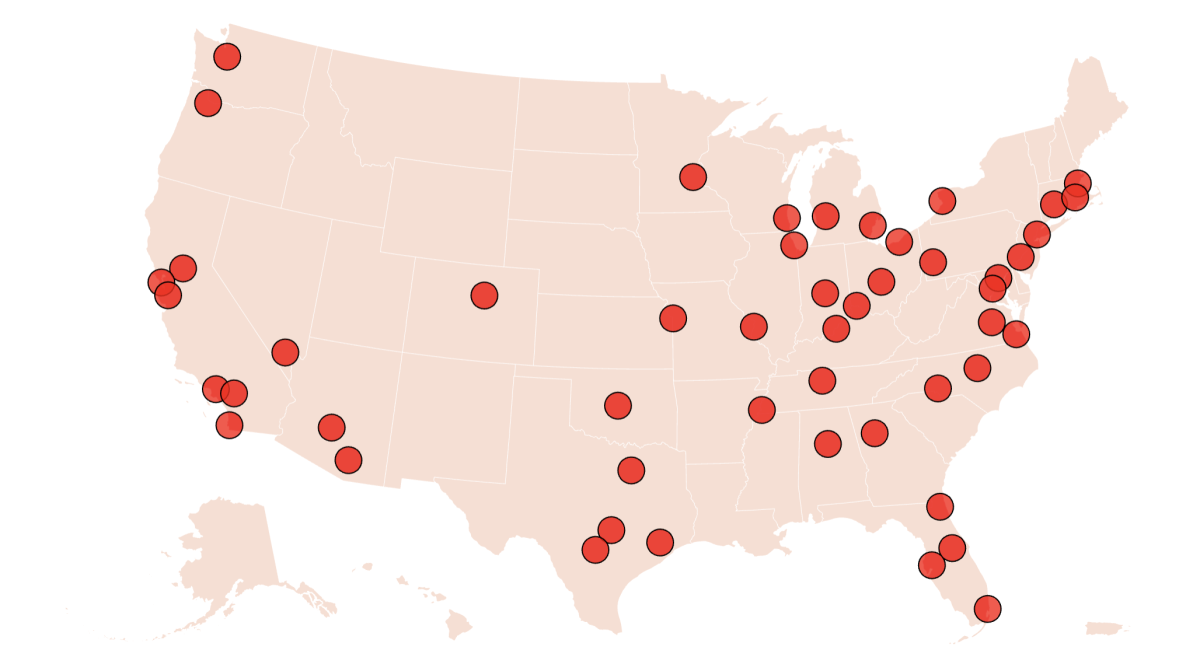
Among the 50 largest U.S. metropolitan areas analyzed by Realtor.com, there were only eight that reported drops in the number of days that listings were spending on the market in June compared to a year earlier.
These were the metros:
- Oklahoma City, Oklahoma (-4 days)
- Baltimore (-3 days)
- Hartford, Connecticut (-3 days)
- Milwaukee (-3 days)
- Richmond, Virginia (-3 days)
- Kansas City, Missouri (-2 days)
- Philadelphia (-2 days)
- Phoenix (-2 days)
Where Homes Are Selling Slowest
Forty-two out of the 50 largest U.S. metros reported an increase in the number of days listings were spending on the market in June compared to a year earlier.
These, according to Realtor.com figures, were the five metros that reported the biggest slowdowns in time on the market in June compared to a year earlier:
- Nashville, Tennessee (+20 days)
- Orlando, Florida (+15 days)
- Miami (+15 days)
- Tucson, Arizona (+12 days)
- Jacksonville, Florida (+12 days)
These figures are in line with regional data showing that listings are spending an increasing amount of time sitting idle on the market in the South and the West, while the Midwest and the Northeast are remaining somehow more competitive.
Listings in the South spent eight days longer on the market in June before finding a buyer than they did a year earlier; in the West, seven longer. In the Midwest, listings sat idle on the market for one day longer than they did a year earlier, and the Northeast reported a modest three-day increase.
This has a lot to do with inventory levels. While the number of homes for sale has surged all across the country in recent months, the South and the West have seen the biggest increases. The number of active listings has spiked by 38.3 percent year-over-year in June in the West; by 29.4 percent in the South; by 21.3 percent in the Midwest; and by 17.6 percent in the Northeast.
Where inventory has grown the most, prices are also dropping. In the Midwest, the median list price of a home was down 0.9 percent in June compared to a year earlier; in the South, by 0.8 percent; and in the West, by 0.8 percent.

Realtor.com


